PetaBencana.id Real-time Flood Mapping in Jakarta
Published on by Water Network Research, Official research team of The Water Network in Technology
PetaBencana.id is a flood mapping platform that combines different sources of data - citizen reporting, social media, government flood alerts and hydraulic sensor data - to provide a single source of flood information for residents and the government.
Jakarta is the world’s second largest megacity, and experiences frequent floods every year. The floods have a serious impact on the 30 million residents of the greater Jakarta area, and rapid urbanization in recent years have increased Jakarta’s vulnerability to flooding risks.
Gathering flood information has been extremely time-consuming in the past. Information had to be collected from responders on the ground, and flooding locations had to be recorded and mapped manually. Because of a lack of data, very little information was available to coordinate response and rescue initiatives.
“There was very little formal data available on the locations of flooding, but we could see massive spikes in Twitter activity during heavy rainfall events. We knew it took the government a long time to collect, consolidate and map the floods to organise response, so the potential of using the tweets as a source of real-time information was immediately apparent,” said Tomas Holderness, Co-Chief Investigator of PetaBencana.
Flood mapping platform
PetaBencana.id is a flood mapping platform that combines different sources of data - citizen reporting, social media, government flood alerts and hydraulic sensor data - to provide a single source of flood information for residents and the government. The platform started as PetaJakarta, focusing on the city of Jakarta, but is now scaling to other cities in Indonesia such as Surabaya and Bandung.

Residents share information on floods via Twitter, and the platform combines incoming reports with government data to build an up-to-the-minute, online flood map. During the 2015-2016 monsoon, 23,000 people used the PetaBencana site, with 3,500 reports of flooding on social media and more than 1.6 million Twitter impressions. In 2016, over 5,000 reports have been submitted to the map, enabling the Jakarta Emergency Management Agency to respond to more than 1,000 flood-affected areas of the city.
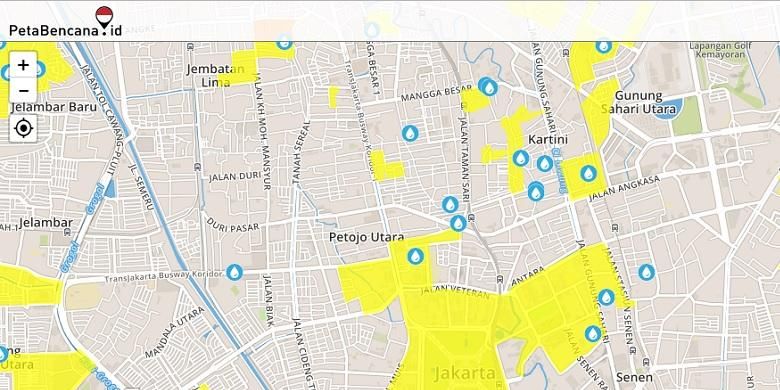
Foto: PetaBencana
User-generated photos of the flooding can be tagged onto the map. Organizing these by neighbourhood district into a 'risk matrix', emergency managers can determine flood heights in near-real time. Once the flood depth for a given neighbourhood is determined, the data is shared publically via APIs and automatically added to the map.
The multistable map scales appropriately according to device. For residents on mobile devices, the map provides a street level view around the user’s current location. For Jakarta’s Emergency Management Agency, an extended interface shows a city-wide situation overview to identify hotspots and coordinate rescue and response efforts.
Open Data approach
The open data approach taken by the PetaBencana team has been a critical component of the project. During a disaster, there is a lot of speculation and conflicting information, especially on social media. By making all the data open and available on a single map, PetaBencana helps to establish trust and transparency between residents and the government, a process they call ‘civic co-management’.
“Simply making the data open was not enough. We had to build a level of trust with residents to encourage them to submit flood reports. Allowing residents to see exactly the same information as the government helped to achieve this,” said Etienne Turpin, Co-Chief Investigator of PetaBencana.
The system is powered by CogniCity, a free and open source software, together with cloud services from Amazon. The map, software and data are shared openly, and can be integrated into systems from government agencies and NGOs tasked with responding to floods. Other countries such as Australia, India and Vietnam are partnering with the MIT Urban Risk Lab to replicate this innovation for major cities facing flooding risks.
At the end of each monsoon season, records of the collected data are stored in the Research Data Australia Archive, ensuring that the information is available to other scientists, engineers and researchers. The goal of the archive is to provide better insight into flood events and help identify ways to alleviate flooding and its impacts.
Source: eGov innovation
Media
Taxonomy
- Technology
- Flood management
- Flood prediction
- Flood Modeling
- Flood Mapping